Cambodia Border Tourism Rebound 2026: Siem Reap and Coast
Cambodia border tourism rebound in 2026: Siem Reap and Sihanoukville read-through for rental demand, hotel occupancy, and secondary property markets.
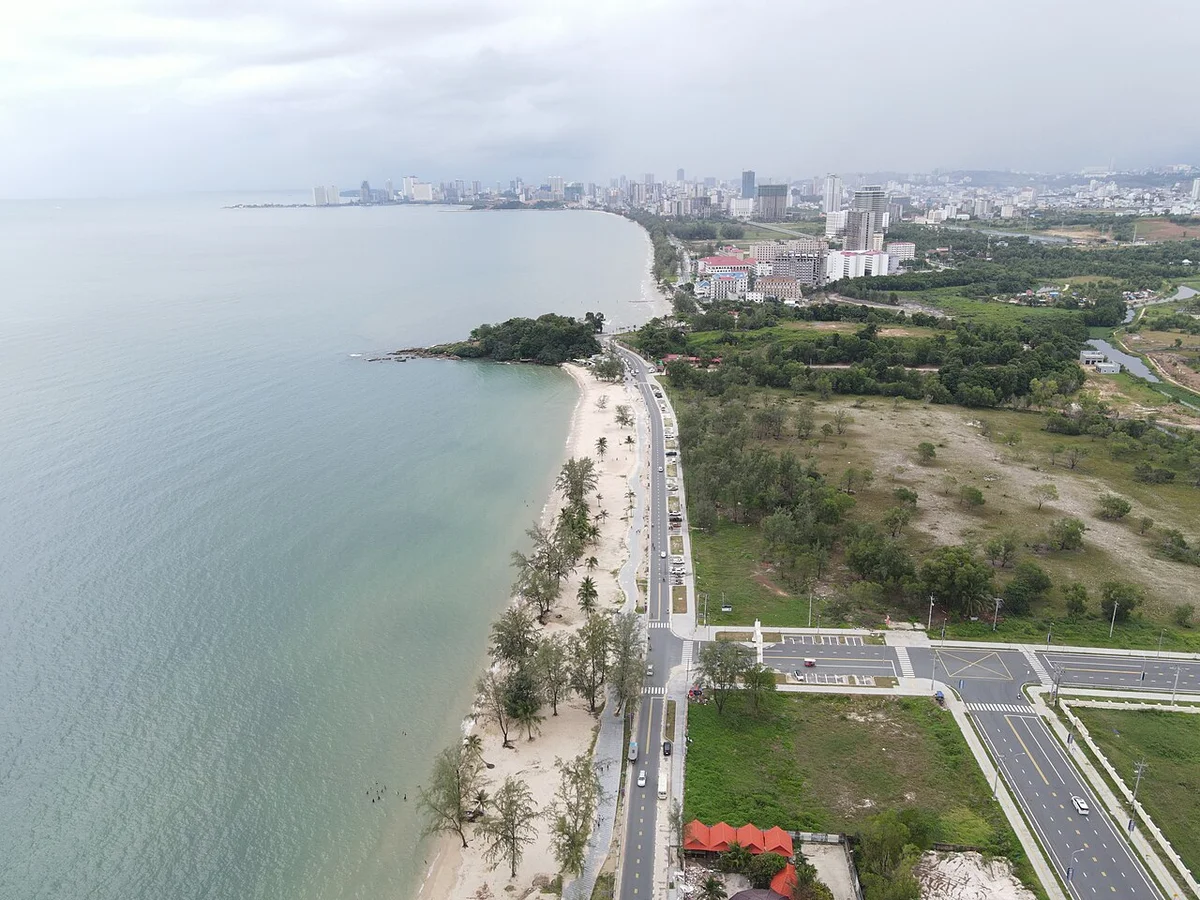
Quick answer: Cambodia’s 2026 border tourism rebound is strongest on Thailand and Vietnam land routes into Siem Reap and coastal gateways, with air volumes still rebuilding. Property investors should link the trend to short-stay rental demand in Siem Reap and managed beach stock near Otres Beach, not assume it lifts central Phnom Penh office rentals.
Coach queues at Poipet and fuller Siem Reap restaurants are useful property data. Cambodia’s leisure recovery in 2026 shows at borders first: Thai and Vietnamese visitors by road, Angkor tour groups returning, and cleaner Sihanoukville beach strips filling faster than during the post-2020 lull. The question is which property types capture that traffic.
Phnom Penh’s condo market runs on expat tenants, not backpacker flows. Tourism rebound matters when you diversify into Siem Reap Property or coastal assets. Compare with Cambodia VS Thailand Property Investment if you are choosing leisure markets in the region.
Which border routes are driving the rebound?
| Gateway | Primary source market | Property read-through |
|---|---|---|
| Poipet (Thailand) | Thai and transit tourists | Siem Reap short-stay demand |
| Bavet (Vietnam) | Vietnamese coach groups | Southern leisure routes |
| Siem Reap airport | Regional and long-haul air | Serviced apartment occupancy |
| Sihanoukville airport | China and ASEAN leisure | Beach hotel and managed units |
| Phnom Penh airport | Business and diaspora | BKK1 expat rentals, not hostels |
Border roads carry much of early recovery while air capacity rebuilds. That helps hospitality assets with direct bookings, not vacant towers far from visitor corridors. See Otres Beach Sihanoukville for the beachfront versus inland split.
What does recovery mean for Siem Reap rentals?
Underwrite seasonality honestly: green-season vacancy hurts naive yield models. Gross 12% to 15% claims rarely survive fees and OTA commissions. Use Phnom Penh Rental Yield Guide net methodology. Completed boutique stock with hotel licences beats off-plan promises; demand occupancy reports before you believe “Angkor recovery” pitches.
| 2026 metric | Indicative value | Buyer use |
|---|---|---|
| Phnom Penh avg price | $1,800 per sqm | Baseline vs district premium |
| Foreign quota cap | 70% per building | Above ground floor only |
| Banking NPL ratio | 8.9% | Developer completion risk |
| Stamp duty window | Through 31 December 2026 | Registration timing |
How is Sihanoukville responding on the coast?
Favour managed units near proven beach strips and verify build quality after rapid past construction. Tourism recovery does not clear completion risk on half-built coastal towers. Urban playbooks such as Techo Airport Corridor and Koh Norea target Phnom Penh growth, not beach seasonality.
Should Phnom Penh buyers care about tourism data?
What tourism numbers mean for a property buyer
Tourism numbers matter to a property buyer only where the tenant is a tourist, which in Cambodia means Siem Reap and the coast rather than Phnom Penh. The capital’s tenants are salaried residents, so arrivals move the coastal and temple markets and leave the capital’s rent roll largely untouched.
| Market | Exposure to arrivals |
|---|---|
| Phnom Penh | Indirect; tenants are residents |
| Siem Reap | Direct; condos are about 20% of stock |
| Sihanoukville | Direct, plus completion legacy |
| Kampot and Kep | Direct, and thin either way |
| Short-stay letting anywhere | Direct, and operationally intensive |
| Long-term letting in the capital | Largely insulated |
Our analysis underwrites tourism-linked stock at the current year’s arrivals rather than at a recovery case, because a buyer does not need to forecast the rebound to make the decision. The red flag worth naming is a projection built on 2019 figures, which describe a market that has not existed for several years and tells a buyer nothing about what a unit will collect next year.
- Arrivals move Siem Reap and the coast, not the capital’s rent roll.
- Underwrite on the current year, never on the pre-2020 peak.
- The head-to-head sits in Phnom Penh versus Siem Reap.
- Hospitality exposure is in the hotel and guesthouse guide.
- Short-stay economics are in the Airbnb guide.
Considering a tourism-led submarket? We will show you the month-by-month letting record before you underwrite an annual figure.
See the seasonalityUpdate, August 2026: the rebound did not reach the temples
This page was written on border traffic. Eight months of Angkor gate data now say something the crossing counts do not. Angkor Enterprise recorded 428,223 international visitors between January and July 2026, down 30.7% from 618,771 over the same months a year earlier, and ticket revenue fell with them, from $28.6 million to $20.3 million. Against a full-year 2025 of 955,131 ticketed visitors and $44.71 million, 2026 is not tracking a recovery at Cambodia’s single most-visited paid attraction.
The national picture is more interesting than either number alone. Arrivals for 2025 came in at 5.57 million, down 16.9% on 2024, while tourism receipts rose 6.6% to $3.878 billion. Fewer people spent more. That combination is what a market looks like when the budget overland segment thins out and the remaining visitors stay longer or spend higher, and it is the opposite of the assumption behind most short-let underwriting, which prices heads through the door rather than money across the counter.
For a buyer the practical consequence is that gate counts and revenue now have to be modelled separately. A Siem Reap unit let nightly is exposed to the visitor count, which is falling; a unit let to the staff, operators and long-stay guests that the higher-spending segment brings is exposed to receipts, which are not. Underwriting either one on “tourism is recovering” gets the direction of the risk wrong, because in 2026 the two moved in opposite directions.
Frequently Asked Questions
Land crossings from Thailand into Poipet and Bavet, plus routes from Vietnam into Bavet and northeastern checkpoints, are reporting stronger coach and self-drive volumes than the 2023 to 2024 trough. Air arrivals into Siem Reap and Sihanoukville are also recovering, though still below 2019 peaks.
Yes, but unevenly. Short-stay demand around Angkor supports serviced apartments and boutique villas near Pub Street and Wat Bo, while long empty seasons still hit poorly located stock. Underwrite 70% to 75% peak-season occupancy, not brochure 365-day tenancy.
Leisure traffic is improving at Otres and selected beach zones, yet oversupply from the 2017 to 2019 build cycle keeps resale liquidity thin. Tourism rebound helps operating hotels and managed units more than speculative land plots far from the coast.
Many regional tourists still enter by road from Thailand for cost and visa convenience, which feeds Siem Reap and coastal routes more than central Phnom Penh office demand. Business travel and expat tenants remain concentrated in BKK1, BKK3, and Tonle Bassac.
Only with a clear rental operator and realistic seasonality model. Phnom Penh condos serve expat and local white-collar demand; Siem Reap and Sihanoukville need tourism-specific due diligence, management contracts, and patience on resale. Read our area guides before diversifying.
Get a Cambodia property shortlist
Share your budget, target district (BKK1, Koh Pich, Koh Norea, Siem Reap), and goal. We reply within one business day with matched stock and next steps.